by MHolland | Jun 11, 2020 | Selling Tips
How do you forecast future sales?
The word “forecast” means – “to predict or estimate (a future event or trend)”.
Cash is tight. You must get your sales forecast to determine your cash-flow.
People make one fundamental error in forecasting sales.
They treat sales like it is one thing.
Sales are not one thing. Sales are three things.
And, those 3 things must be separately measured. It is the only way you can gain control of your forecast.
Sales are a lot like profit. We measure net profit and we measure sales. But they are more like a scorecard result than an item you can impact directly.
Let me give you a simple example. Take the game of hockey. You want the score to go up. (Think of the score like sales).
How do you do that? You are the coach. How do you score more goals?
More shots on goal might lead to a higher score. So, focus on “shots on the net” in order to get a higher score.
What are the 3 things that make up sales? You will groan because it is so obvious. Yet it is missed all the time.
The first is….
Number of Customers
The first question to ask is – “how many active customers do we have right now?”
They must be actively buying from you. Not just on a customer list.
Sales are from customers buying stuff. To increase sales, you must look at increasing the number of customers.
The first number to “find” is your number of customers.
Let us say you have 300 customers. Great, that is what we start with.
The second number we must find is…
How Often Do They Buy?
How many times (on average) does each customer buy from you?
This is called “Transaction Frequency”.
You get this number by dividing the total transactions in a given period (1 year, for example) by the number of active customers.
In our example, let us say you had 15,000 sales transactions last year.
You divide 15,000 by 300 customers and you get 50.
Fifty is the average number of times each customer is shopping. (300 x50 = 15,000).
Said another way, they are shopping a little less than once a week throughout the year.
You now have two critically important numbers.
Number of customers, and, the frequency that they shop, on average.
The third number in our secret formula is…
The Average Sale Per Transaction
How much does each customer spend when they purchase from you?
To get this number you first find your total sales for the period. Next find your total transactions.
Imagine your sales for the past 12 months are $3,150,000. We know the total transactions are 15,000 (see above).
The average sale per transaction is $3,150,000 divided by 15,000 = $210
Putting it all together we have 300 customers shopping on average just over once a week (50 times a year) and spending $210 per purchase.
30 customers x 50 times of shopping x $210 spent each time = $3,150,000.
Why is this so important?
You cannot make the score go up in hockey by staring at the scoreboard. More shots on goal are needed.
You cannot make sales go up without focussing in on these 3 separate items. You will need a separate strategy for each one.
Before we look at strategy, let us look at how the numbers interact.
Take a look at this table:
| Components of Sales: |
Present |
Change |
Possible |
| Position |
Factor |
Position |
| Number of Customers |
300 |
5% |
315 |
| * Average Purchase Frequency per annum |
50 |
5% |
52.5 |
| Number of Sales Transactions |
15,000 |
|
16,537.5 |
| * Average Sales Value |
$ 210 |
5% |
$220.50 |
| Total Sales Revenue |
$3,150,000 |
|
$3,646,518 |
| Increased Sales |
|
|
$496,519 |
Note the amazing power of a small 5% increase in each of those 3 areas. Compare that to concentrating on only one area!
In Summary
Sales can increase by $500,000 in this example. How? With a 5% increase in 3 areas:
- 5% increase in number of customers
- 5% increase in how often they shop on average
- 5% increase in how much they spend when they shop
Each area has a different strategic focus. To get new customers is expensive. To get them to come back more often requires a different mindset. It is also way less expensive.
So, the lesson is this – when forecasting sales do not just add a percentage to last year’s sales and hope for the best.
First break down your sales into this 3-part formula.
Finally, work on increasing each of the 3 parts with a different strategy. That is more for another Blog.
Thanks for reading…
by MHolland | Jun 5, 2020 | Business Tips
Being in business is just about creating and selling stuff. Delivering services. Right?
Wrong. It is about creating advocates for your business. There is a pathway to creating advocates. It is narrow and uncrowded.
Would you like to know what it is?
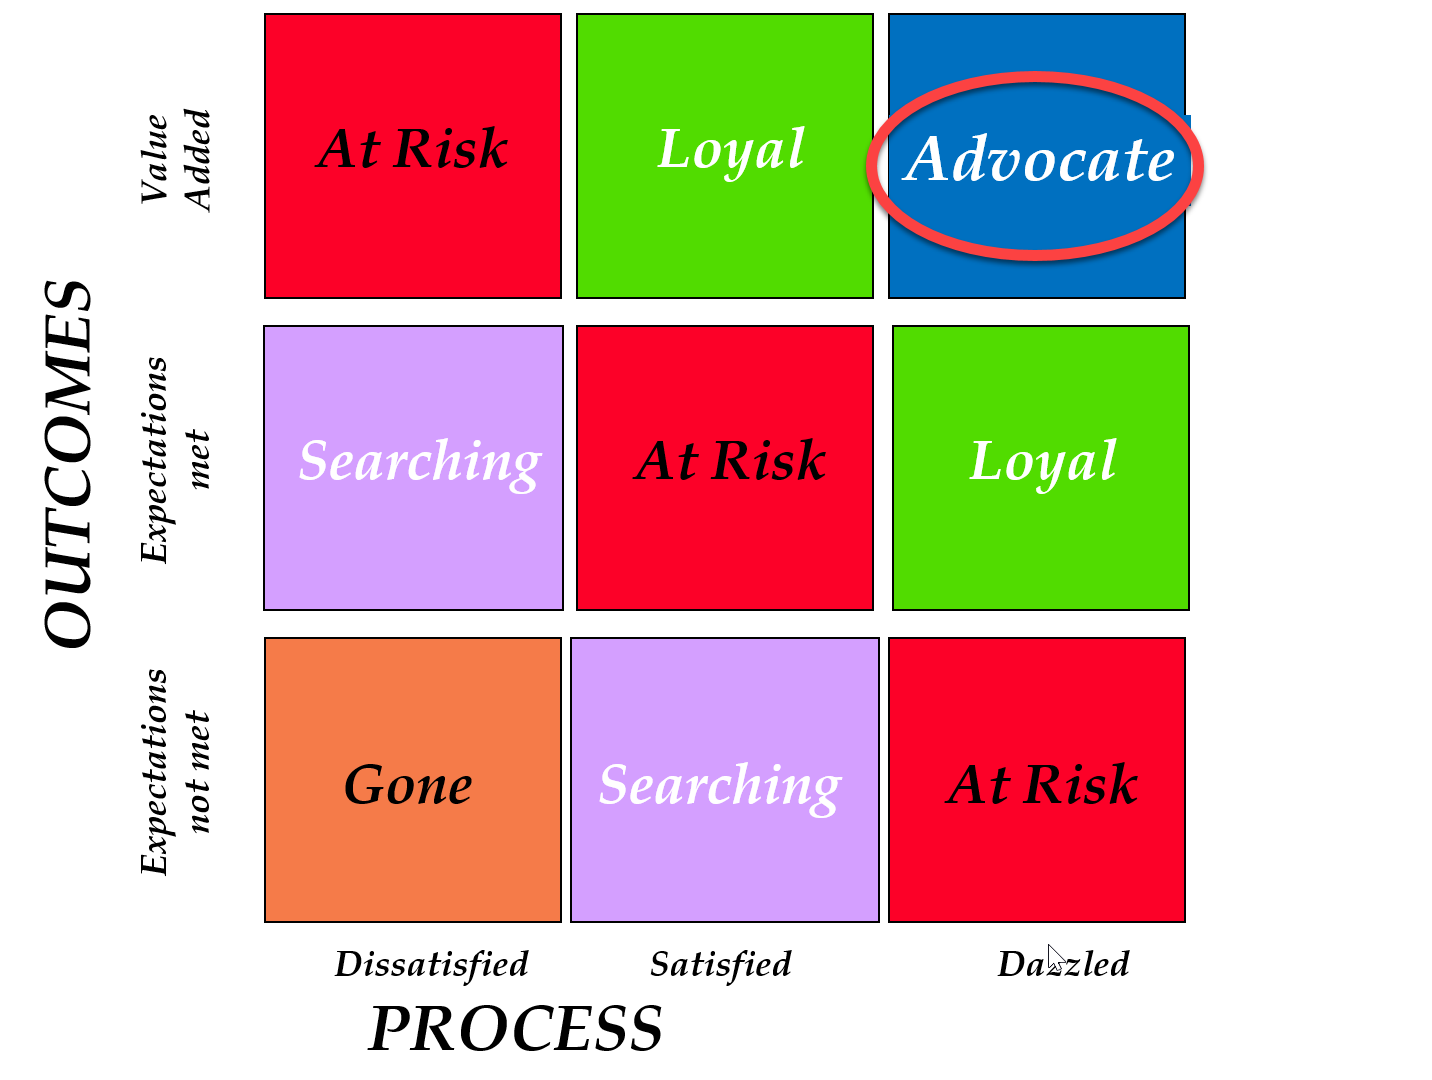
The best way to show you is with a Chart, a grid.
It looks like this:

The vertical axis is what you do – your outcomes. A law firm provides legal services. A restaurant? Meals. Clothing store? Clothes. You get the idea.
The question going up the chart is – did I ‘not meet’, ‘meet’, or exceed my customers’ expectations?
You go to a restaurant. Your meal was either crappy (not met), good (met), or just like mom’s cooking (exceeded).
Now look at the horizontal axis. It is called “Process”.
It is not how you do what you do (that is operations). It is how you deliver what you do.
Everyone knows you can get a great meal, and lousy service. It can be lousy in any number of ways.
A grumpy, rude, indifferent, or distracted server for example.
The “process” part is the people part. Did the business show they cared for you?
The Colors Are the Clue
Look carefully at the Chart above. The colors are a clue. There are 3 red boxes, 2 green, 2 purple, 1 brownish, and 1 blue.
Let me unpack it for you.
The Color Brown
The bottom corner – in our restaurant example – means the food is bad, AND the service was horrible. You are gone. And, likely you will tell a lot of people. Way more than when it is great.

The Color Purple
Look at the 2 purple boxes next. In the bottom, middle box the food is bad, but the server was friendly. (Expectations not met, satisfied with the service). In the middle, left box the food is good, and the service is horrid. (Expectations met, dissatisfied with process).

What do you do?
You are searching. You want a better restaurant to go to. Perhaps you are not gone – just yet – but actively looking!
The Color Red
Three boxes are red. Bottom right red box – you are dazzled with service; food is really awful. In top left red box – the food was terrific (better than expected), but the server was rude.
Middle red box – everything is good. Not great. Good. Food is good. Service was good. You are satisfied. Just not running home to share with your friends and family about the place.
As the business owner of this restaurant, are you secure?
No. You are “at risk”. Those customers could leave you. They will leave you when something better comes along.

The Green Boxes
There are two possibilities here. Either the food was amazing, and the service good. Or, the service was dazzling, and the food was good, not great.
You are safer here indeed. Because you have something all businesses long for.
Check it out below.

You have loyal customers.
So, what is wrong with that? Isn’t that enough. Sure. It is good. But is that what you really want? Because there is one piece missing. One secret ingredient.
Remember what I said at the beginning? The road is narrow and the gateway is small.
This leads us to the last box….
The Blue Box
The blue box is where your advocates live.
In this lonely top corner box, you have been blown away with the meal AND the service dazzled you.
And here is the lesson. The one thing advocates do (something even loyal customers do not do) is this:
- They cannot stop talking about your business
They are a walking, talking billboard for your company. They rave about you to friends and family and on social media. Stories are shared about you – good stories. They smile telling their friends about their experience. They gush a bit.
Here is the challenge (for all of us in business). Not how we get there. We may be able to pull that off – occasionally.
It is how do we stay there. How do we embed that dazzling experience with outstanding products/services into the DNA of our systems?
Thanks for reading….
PS – the above distinction applies as much – actually more – during a pandemic
by MHolland | May 27, 2020 | Business Tips
People love to shop. Businesses love to expand. Businesses and people spend what they earn…
The one thing they do not have enough of is what?
Savings.
The pandemic created a global liquidity shock. Customer A owes your business money. They lost 95% of their sales. They cannot pay you.
You, then, cannot pay your suppliers. And so on, and so on, and so on…
It is global. It is a shock. And, it means you have no cash coming in.
What to do?
Downsize, for one. Scale back. Get lean.
The pandemic has showed a lot of people what they did not do. Save money.
Most people and businesses spend what they earn. They feel this pressure to “look the part”.
When you make more, you want to drive a better car. Live in a bigger house. Wear fancier clothes.
The same is true for businesses.
And, here is the raw truth faced by everyone:
Did you save enough money to last 6 months?
I mean, enough to pay all your expenses with not a shilling coming in.
Spending Can Be an Addiction
We buy stuff for many reasons. It can be because we need something.
It may be because there is a hole inside that you are trying to fill up. And, as in all addictions, spending will not, cannot, fill that hole.
Consider it may be a desire to “look good”. You look around, your neighbours, friends, and family drive better cars. You feel “less than”. So, you spend to “keep up with the Joneses”.
Here is a rule of thumb:
Save first
Put money into a vault. Spend what is remaining. I am not suggesting becoming a miser. I am saying – save first, not last.
When you save last, there is usually nothing left. It is all spent.
Here are some focus points to think about before you spend*:
Do not shop.
Live within your means.
Take care of what you have.
Wear it out.
Do it yourself.
Anticipate your needs.
Research value, quality, durability, and multiple use.
Get it for less.
Buy used (especially cars).
*Courtesy of Joe Dominguez, Your Money or Your Life
The Most Impactful Graph, Ever
The following “fulfillment chart” is the most impactful graph, ever. I saw it years ago and it changed me.
What it shows is that fulfillment does indeed go up with each dollar spent.
In the beginning! When you have NO food, clothes, or shelter.
Money spent creates great fulfillment when buying these basics. Remember that first old beater you had when 16 or 17? I do. Loved it. How about your first little studio apartment. The one that was all yours. Fulfilling just to remember, isn’t it?
As you move up the left side of the graph (fulfillment) you reach a crossover point. That point is called “enough”. That is the point where each dollar you spend brings less and less fulfillment.
In fact, it starts going down! Yup. #truth. It goes down…
How does that work?
The effort required to “get more stuff” means more work, less savings, and higher stress.
Let me illustrate with an exaggerated example. Someone you know has a nice house, good job, wife, and 3 kids.
They want more. They buy a bigger house. House comes with fatter mortgage. But that is ok, because the husband just got promoted and has more income to cover it.
But the promotion comes with higher expectations. This means longer hours at the office. Less time with the family.
The husband – to relieve stress – has a brilliant idea! Buy a motorhome so the family can spend more time together on holidays!
The wife takes a part-time job to pay for the motorhome payments.
The family is spending less time together now. The stress has the husband drinking more and eating poorly. And then a pandemic hits. Unexpectedly.
What to Do Now (If You Did Not save)?
Cut back every discretionary expense you can. Grow your own food in a backyard garden. Start saving now. It is not too late. Get creative. A crisis forces creativity!
Remember principal number one – save first.
And, as we start to come out of this pandemic, please, do not go back to old spending habits. I repeat do not.
Thanks for reading…
by MHolland | May 21, 2020 | Accounts Receivables
Selling on credit is risky…
Businesses closed in the pandemic. Meaning they cannot pay you. Or, you cannot reach them, as offices closed.
What to do?
Three things.
Number One – Re-Set Your Credit Terms
It is better to have no sale than a bad debt.
A bad debt is awfully expensive. It is not just the cash loss. It is the recovery cost.
Imagine you have a 30% gross margin percentage. This means if you sell something for $100 that item cost you $70 ($100-$70 = $30). $30 divided by $100 = 30%.
With me so far?
A bad debt of $6,000 translates to $20,000 in new sales required to re-coop it.
Do the math. $6,000 is lost – the bad debt. Divide that by 30% to get $20,000.
Now work it backwards. You sell $20,000 x 70% in costs = $14,000. Subtract your costs of $14,000 from $20,000 in sales leaves you with a gross profit of $6,000, or 30%.
That is what you must do in sales to get back to where you were before the $6,000 bad debt.
I hope that makes you cringe a little.
Re-set your credit terms. You get to say. If your customer refuses, they do not want to do business with you.
Number 2 – Chase More Aggressively
Go after those accounts owing fast.
Call days after you send the invoice. “Did you receive my invoice? By when can we expect payment?”
Use a system to chase them with persistent and professional emails.
We use a software program for our clients designed to do only this.
And, it works. Our clients have lower “days receivable” as a result.
Follow up aggressively, and persistently.
Following-up for sticky ones should be done at the highest level. The owner.
Why? No one feels the pain more of that loss than the owner. That pain will come through in the “tone” on that call.
Number 3 – Do not Use Your Bookkeeper to Make Calls
Your bookkeeper is a bookkeeper. They like bookkeeping. Making calls is not fun for them. Why? They are introverts.
You can force them to do it.
Remember, they did not set your credit terms; nor do they choose your customers.
How can they possibly be responsible for collections?
There are professional accounts receivable collection experts. You can hire an expert in-house. Or, you can outsource it.
Outsourcing is not cheap – usually a percentage of the amount collected is billed.
To Summarize:
- Update and tighten up your credit terms
- Aggressively pursue amounts owing to you. Use a system for email chasing. Follow-up with phone calls
- Use a professional – not your bookkeeper. Or you, as the owner, make the calls.
Thanks for reading…
by MHolland | May 13, 2020 | Cash Flow
We are in the midst of a global liquidity shock.
What is that? It goes like this. Business A is not getting paid. To preserve cash they stop paying their payables.
Business B is Business A’s supplier. Business A’s account payable is Business B’s “accounts receivable”.
Business B, in turn, tells its suppliers that “no one is paying us!”. So, we cannot pay you. Ouch.
Business C (customer of Business B) says the same thing to its suppliers…
…and so on, and so on, and so on…
It is a Global Liquidity Shock.
To manage your cash-flow you must know three things it is made up of.
First Thing – Cash-Flow From Operations
You sell stuff. You have expenses. The difference is your net profit. So far so obvious…
Imagine you sold only for cash. You paid for things only with cash. Your net profit would equal your operational cash-flow.
That is not what happens though is it?
People do not all pay cash. You do not pay all expenses with cash.
Accounts receivable will become cash when collected. Inventory becomes cash when sold.
Accounts payable and other things you owe will use cash later on.
The first section of your Cash-Flow statement is called Operational Cash-Flow.
You begin with “Net Profit”.
Did “accounts receivable” go up from last month? Subtract the difference from net profit. You have not received that money yet.
Did “inventory” go down from last month? Add the difference to your net profit. You sold stuff.
Have your accounts payable gone up? You have not paid all your bills. Add the difference to your net profit.
Rule # 1 : every current asset that goes up you subtract that from your net profit. Every current asset that went down you add that to your net profit.
Rule # 2 : every current liability that went up you add that to net profit. Every current liability that went down you subtract that from net profit.
Rule 2 is the exact opposite of Rule 1.
Here is a sample Operational Cash-Flow:
| Net profit |
$6,000 |
| Accounts receivable went up |
(600)* |
| Inventory went down |
900* |
| Accounts payable went up |
3,000** |
| Operational cash-flow |
$9,300 |
|
|
*see Rule #1
**see Rule #2
Part 2 – Investing Activities
There are other things that affect cash-flow that are long-term. Buying fixed assets is one example.
You take the Operational Cash-Flow as above. And deduct the investment in long-term things like fixed assets.
It looks like this:
| Operational cash-flow |
$9,300 |
| Purchase of equipment |
(6,000) |
| Loaned money to another company |
(3,000) |
| Cash-flow before financing activities |
$300 |
Part 3 – Financing Activities
Now, you take your Cash-Flow before Financing activities as above. You add or subtract things like long-term loans and shareholder dividends.
These include long-term loans and dividend payments to shareholders.
You start with your cash-flow before financing activities as above:
| Cash-flow before financing activities |
$300 |
| Long-term loan from bank* |
6,000 |
| Dividends to shareholder |
(2,100) |
| Cash-flow before financing activities |
$4,200 |
*you financed the equipment above assets
3 Cash-Flow Tips
- Push hard (with kindness) on accounts receivable collections. Use software to chase outstanding invoices. Make calls. Document everything.
- Extend payments on accounts payable. Work out payment terms with your suppliers.
- Finance equipment with long-term loans.
Thanks for reading…(if you need help, private message me)